Yes, shit just hit the fan. What are you gonna do?
If you are thinking about integrating OMD or Check_MK alert notification with PagerDuty.com, you are in the right place. The official documentation from PagerDuty is not done right by the Flexible Notification feature provided with OMD (Open Monitoring Distribution) or Check_MK.
If you don’t know what Flexible Notification is or what OMD is about, I recommend you to check out my other blog post - The Best Open Source Monitoring Solution 2015.
Create Notification Service on PagerDuty
Step 1. Log in to PagerDuty as an admin user. Click Service under the Configuration menu option.

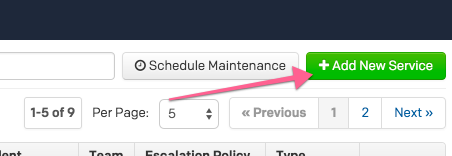
Step 2. Click the Add New Service button.

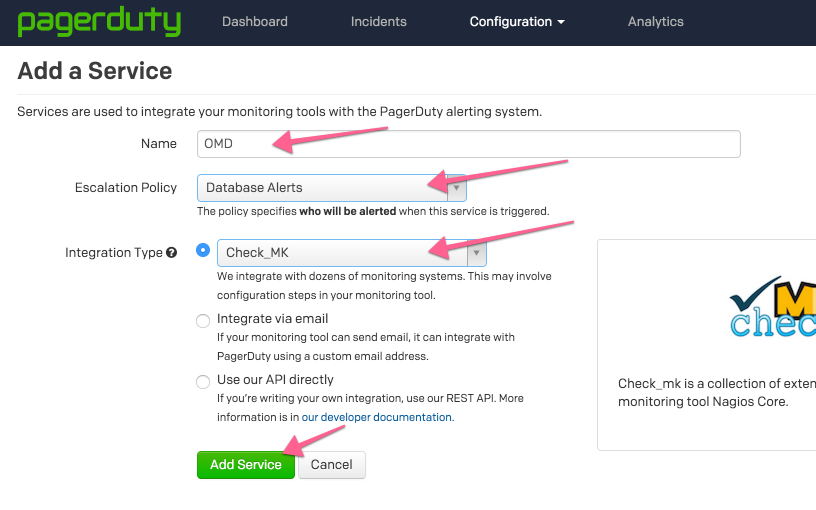
Step 3. Fill out the form as the arrows indicated in the following image.
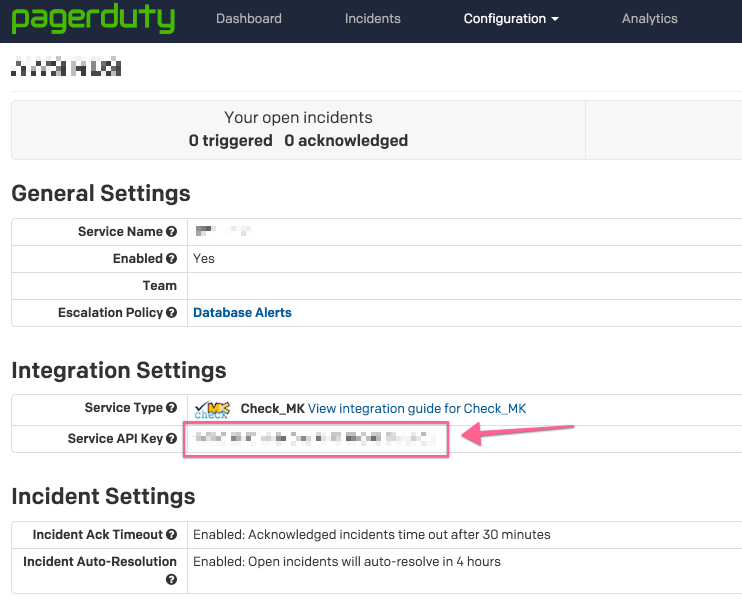
Step 4. Congratulations, we are done with the PagerDuty part. Grab the Service API Key for you are going to need it later.

Install PagerDuty Notification Script
Step 1. SSH into the OMD server
Step 2. Install Perl dependencies
FOR RHEL, Fedora, CentOS, and other Redhat-based distributions:
yum install perl-libwww-perl perl-Crypt-SSLeay perl-Sys-SyslogFor Debian, Ubuntu, and other Debian-based distributions:
apt-get install libwww-perl libcrypt-ssleay-perl libsys-syslog-perlStep 3. Download pagerduty_nagios.pl from github, copy it to /usr/local/bin and make it executable:
wget https://raw.github.com/PagerDuty/pagerduty-nagios-pl/master/pagerduty_nagios.pl
cp pagerduty_nagios.pl /usr/local/bin
chmod +x /usr/local/bin/pagerduty_nagios.pl
Step 4. Create cron job to flush notification queue
First become the OMD/Check_MK site user in shell, then create a cron.d file under /omd/sites/<<Site Name>>/etc/cron.d/pagerduty with the following content:
#
# Flush PagerDuty notification queue
#

* * * * * /usr/local/bin/pagerduty_nagios.pl flush
Now enable the cron job as the OMD site user:
omd reload crontabSince the cron job runs every minute, you can change back to the root user and check to see if the cron job has been triggered as expected.
[root@omd.server.com ~]# tail -f /var/log/cron
Sep  4 08:25:01 omd.server.com CROND[24090]: (omd_user) CMD (/usr/local/bin/pagerduty_nagios.pl flush)
Sep  4 08:26:01 omd.server.com CROND[27175]: (omd_user) CMD (/usr/local/bin/pagerduty_nagios.pl flush)
Sep  4 08:27:01 omd.server.com CROND[30195]: (omd_user) CMD (/usr/local/bin/pagerduty_nagios.pl flush)
Integrate with OMD Flexible Notification
Assume you are still connected to OMD server with SSH.
Step 1. Adding custom Flexible Notification script
copy and save the following script to location /omd/sites/{YOUR-SITE}/local/share/check_mk/notifications/pagerduty.sh
#!/bin/bash
# PagerDuty

PAGERDUTY="/usr/local/bin/pagerduty_nagios.pl"

# For Service notification
if [ "$NOTIFY_WHAT" = "SERVICE" ]; then
    echo "$PAGERDUTY enqueue -f pd_nagios_object=service -f CONTACTPAGER=\"$NOTIFY_PARAMETER_1\" -f NOTIFICATIONTYPE=\"$NOTIFY_NOTIFICATIONTYPE\" -f HOSTNAME=\"$NOTIFY_HOSTNAME\" -f SERVICEDESC=\"$NOTIFY_SERVICEDESC\" -f SERVICESTATE=\"$NOTIFY_SERVICESTATE\""
    $PAGERDUTY enqueue -f pd_nagios_object=service -f CONTACTPAGER="$NOTIFY_PARAMETER_1" -f NOTIFICATIONTYPE="$NOTIFY_NOTIFICATIONTYPE" -f HOSTNAME="$NOTIFY_HOSTNAME" -f SERVICEDESC="$NOTIFY_SERVICEDESC" -f SERVICESTATE="$NOTIFY_SERVICESTATE"

# For Host notification
else
    $PAGERDUTY enqueue -f pd_nagios_object=host -f CONTACTPAGER="$NOTIFY_PARAMETER_1" -f NOTIFICATIONTYPE="$NOTIFY_NOTIFICATIONTYPE" -f HOSTNAME="$NOTIFY_HOSTNAME" -f HOSTSTATE="$NOTIFY_HOSTSTATE"
fi
Step 2. Make it executable
chmod +x pagerduty.shStep 3. Log in to OMD or Check_MK web interface and configure Flexible Notification to use the NEW PagerDuty notification script.
Assuming you already know how to operate Flexible Notification. Select PagerDuty as the Notification Plugin and put the API key you acquired earlier when setting up PagerDuty service into the Plugin Arguments field as shown in the image.

Since pagerduty_nagios.pl was designed to work with Nagios, it doesn’t take flapping notifications. Make sure you uncheck those boxes.

You can create multiple PagerDuty services and pair them up with OMD/Check_MK Flexible Notification. Happy ending.
Testing and Troubleshooting
Test pagerduty_nagios.pl
To send a test notification directly with the pagerduty_nagios.pl, use the following example and swap out <<API Key>> and <<HOST Name>> with your own value.
Make sure you become the OMD site user first because once you run the command once, it’s going to create a directly in /tmp/pagerduty_nagios. If you run the command as root now, you will have permission issue later when OMD is trying to send notification to PagerDuty with a different user.
/usr/local/bin/pagerduty_nagios.pl enqueue -f pd_nagios_object=service -f CONTACTPAGER="<<API Key>>" -f NOTIFICATIONTYPE="PROBLEM" -f HOSTNAME="<<HOST Name>>" -f SERVICEDESC="this is just a test" -f SERVICESTATE="CRIT"You will be able to find output in syslog, and depend on the OS variation you use, location may vary.
If you get the following error message like I did:
perl: symbol lookup error: /omd/sites/<<site Name>>/lib/perl5/lib/perl5/x86_64-linux-thread-multi/auto/Encode/Encode.so: undefined symbol: Perl_Istack_sp_ptrAdd the following lines to the beginning of the PagerDuty Perl Script located /usr/local/bin/pagerduty_nagios.pl
use lib '/usr/lib64/perl5/';
no lib '/omd/sites/monitor/lib/perl5/lib/perl5/x86_64-linux-thread-multi';
Test with Flexible Notification
Step 1.
You first need to enable debugging for notification from the web UI. Enable setting in Global Settings -> Notifications -> Debug notifications. The resulting log file is in the directory notify below Check_MK’s var directory. OMD users find the file in ~/var/check_mk/notify/notify.log. Remember switch it back after you are done debugging.
Step 2.
Now pick a Host for Service that you’ve configure it’s notification to use the PagerDuty plugin, Click the Hammer icon on the top and click on Critical button in the Various Commands section.

Step 3.
Now log in to the PagerDuty account and select Dashboard form the top menu. In a minute or two, you should see some thing as shown in the image. If not, you need to go back to the log files and figure out why.

If you do see your fake incident appear on the PagerDuty dashboard, CONGRATULATIONS .
Share with us, comment on what notification mechanism do you use? Do you build it in-house or use a popular 3rd party service?


