Why is OMD the Best Open Source Monitoring Solution over Zabbix, Zenoss or Sensu
I spend about 3 weeks vetting through 20+ open source monitoring solutions and at the end of the process, the choices had boiled down to few major ones - OMD (best combination of open source plug-ins put together for Nagios), Zabbix, Sensu, and Zenoss.
The main components of OMD are Check_MK, PNP4Nagios, Nagvis, and of course Nagios. Among these projects, Check_MK is the core of OMD that makes Nagios easy to configure, easy to scale, and mashed together all the other popular Nagios plug-ins into one unified user interface. Thus the following comparisons are done using Check_MK as the keyword, but I will also cover how other plug-ins makes OMD project stand out from the competitions.
Update: 2015.08.29
I have the opportunity to build a new monitoring platform from scratch again, so I wanted to make sure if there is any better solution than OMD. I have gone though a series of new comers and the Monitorama conferences (2014 ~ 2015). OMD still is the only one that ships with everything you need to do the monitoring job right. Some of the new tools focus on API and scalability (which OMD has both) but doesn’t really give you a easy to use or the lack of GUI to manage your infrastructure with less command line or coding capable people.
Trend
Check_MK vs Zabbix vs Zenoss Core Trend

A quick Google Trend search will tell you that Check_MK is up and rising. Together with the Nagios’s community size, you can certainly find custom monitoring plug-ins created by community members and save yourself time from reinventing the wheel.
Project Health
Before you pick any open source tool for enterprise projects, you want to make sure that their code is not stale and the community is vibrant for the years to come. Active community and frequent code updates ensure your questions get answered and fast bug fixes. Free service from Ohloh will give you an overview of those aspects on open source projects. The following comparison charts are created from Ohloh.
Number of Code Commits Made by Each Project

Check_MK is a clear winner in this chart. It tells you that Check_MK is constantly making more improvement than the other 2 projects.
Number of Contributor of Each Project

In this chart, Check_MK’s contributor is increasing and will soon surpass Zabbix. And don’t forget it is standing on giant’s shoulder, the largest monitoring community - Nagios.
User Reviews
Don’t just listen to me. Here is one of the blog post that talks about why moving away from Zabbix to Check_MK.
Architecture Design Advantage
OMD
- What is OMD:
- OMD is a combination of best practices on how Nagios should be setup and integrated. It has incorporated all of the most popular 3rd party Nagios plug-ins in single easy to maintain, easy to install, and easy to upgrade package. Once you have your Linux server running, installing and have your OMD monitoring suite running only takes about 10 minutes with one command.
Administrators can really save time on not having to compile Nagios, or other plug-ins, trying to integrate and mess with configurations between plug-ins and Nagios. It really is a no-brainer to setup and start with.
- Why use OMD instead of other flavors of Nagios combos, e.g. ?
- Founded July, 2010 by a group of well known Nagios community members and Nagios addon developers
- e.g. NagVis, Check_MK, PNP4Nagios, and others
Check_MK
What is Check_MK
Check_MK is an extension to the Nagios monitoring system that allows creating rule-based configuration using Python and offloading work from the Nagios core to make it scale better, allowing more systems to be monitored from a single Nagios server.

There are 2 significant modules that Check_MK uses to improve Nagios performance. One is called Livestatus and the other is called Livecheck.
Livestatus
Before Livestatus ☹
- Monitoring results are stores to a single file
status.dat. It becomes a bottleneck on CPU and IO for larger installation. statusfile status is not realtime, default is to update every 10 seconds.- NDOUtils utilize databases for monitoring results (MySQL or PostgreSQL), but still have some severe shortcomings.
- NDOUtils has complex setup.
- NDOUtils needs a databases to be administered, a rapidly growing one.
- NDOUtils eats up significant portion of your CPU resources just to keep the database up to date.
- Some similar projects that still uses NDOUtils:
- Regular housekeeping of the database can hang your Nagios for minutes or even an hour once a day.
After Livestatus ☺
- Livestatus also uses Nagios Event Broker API like NDO, but it does not actively write out data. Instead, it opens a socket by which data can be retrieved on demand.
- Livestatus imposes no measurable burden on CPU at all.
- Livestatus produces zero disk IO when querying status data.
- No configuration is needed. No database is needed. No administration is necessary.
- Livestatus scales well to large installation even beyond 50,000 services.
- Livestatus give you access to Nagios-specific data that is not available to any other methods.
Livecheck
Before Nagios 4.0, Even a perfectly tuned system rarely manages to execute more then a few thousand checks per minute.
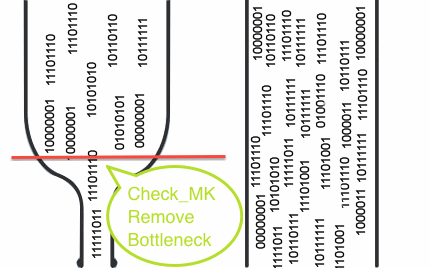
What make things worse: while your system is getting larger, the maximum check rate is even getting worse. The more hosts and services your system manages, the less checks per second it will be able to perform. Why?
Existing Problems of Nagios (before Nagios 4.0) ☹
- Each new check creates a new fork
- The new process prepare everything needed to execute the check plug-in, then fork the second time when ready
- Forking is costly even for highly optimized Linux kernel
- The forking of Nagios core (before v.4.0) does not scale on multiple CPUs (single thread process).
- you can well run into a situation where your powerful 16-CPU server is limited to 100 Checks per second while most of its CPU cores are idle most of the time.
How does Livecheck solve those bottlenecks ☺
- It uses a number of helper processes. The core communicate with each helper through a Unix socket (that does not appear in file system).
- Only a small helper program is forked instead of the complete Nagios monitoring core.
- The helper forks distribute over all available CPUs instead of single CPU.
- The total process VM size of Livecheck is about 100KB only!
- Inline implementation of check_icmp (PING tests). To give you an idea of how much improvement this has done, here is a benchmark example using dual core 2800 MHz CPU:
- Before inline check_icmp: 300 ICMP checks per second.
- After inline check_icmp: 2600 ICMP checks per second. The checks generated an ICMP traffic of 45Mb/s.
Nagios Monitoring Core working with the best plug-ins (Check_MK, NagVis, PNP4Nagios and etc)

Multisite - An Advance Web Interface for Nagios
Multisite is part of the Check_MK project as a better web UI alternative for Nagios.
A new and innovative GUI for viewing Nagios status information and controlling your monitoring system. It is based on MK Livestatus and aims at replacing the Nagios web GUI (also known as “the CGIs”). Multisite supports distributed monitoring in a very efficient way.
Zero Configuration Files with WATO
This is one of the most brilliant solutions from Check_MK project to tackle the notorious Nagios configuration disaster. Although Nagios is a flexible and powerful monitoring system, having to mess with its multi-level and confusing configuration files scares many people away. Now, there are many web interface plug-ins that try to take a stab at the issue, but WATO is by far the best that simplify the complexity of Nagios configuration while staying very flexible and more flexible by sitting on top of Check_MK.
WATO is a web based administration tool for Check_MK. It allows you to manage your hosts and services to be monitored and perfectly supports Check_MK’s mechanism of inventory to autodetect services to be checked on a host. WATO allows to move a substantial part of the daily workload from the monitoring administrator to his colleagues.
Monitoring Agent for both Linux and MS Windows

Responsive UI for Mobile Client
Powerful Search Function
Visual Meters with Perf-O-Meter

NOC with Dashboards (Thanks to PNP4Nagios & Nagvis)
PNP4Nagios
Nagvis
NagVis is a visualization addon for the well known network managment system Nagios. NagVis can be used to visualize Nagios Data, e.g. to display IT processes like a mail system or a network infrastructure.

Check_MK (OMD) API for Automated Provisioning
Automation is build into Multisite (Check_MK UI). You can make web service request against the API to automate adding new host, enabling new service checks, or embed any of the host/service check web pages into any other websites.
This feature makes it very easy to integrate with configuration mangement tools like Puppet or Ansible for automatically adding new servers(hosts) and services to the monitoring system.
24/7 NOC with Flexible Notification
With Check_MK abstracting the original Nagio’s notification scheme, it has become possible to send notifications of any hosts or services to any number of people at any time.
You can even create custom script to send the notification in some creative ways like having the notification be ☎called via a VoIP server to your cell phone and read you the alert message or have the alert be sent to your ✐instant messenger.
If you are currently using PagerDuty as your notification service provider, you can check out my other post on OMD (Check_MK) Alert Notification Integration with PagerDuty Done Right.
Custom Icons
This is really one of the hidden gem of Check_MK (OMD) feature that will dramatically reduce the MTTR (Mean Time to Repair). I will be writing another post about the things I have implemented to make the NOC team more efficient at troubleshooting and putting out fires.
http://mathias-kettner.de/checkmk_devel_multisite_icons.html
Management and Maintenance
Scaling with Distributed Monitoring
Distributed WATO allows you to manage several monitoring sites through a logically centralized WATO.
- 1200 Check_MK installations
- Centralized status of all 1200 stores per minute
- Using NagVis to show all 1200 stores’ status on the map using the Geomap function
- All stores’ overall status is aggregated through the use of the Business Intelligence function

Backup of Changes
- Automatic Check_MK configuration backup on every change you make
- Easy restoration with the Thunder icon

Upgrade OMD
- OMD upgrade DEMO Version
- OMD copy a site
Business Intelligence
Available from version 1.2.3
Predictive Monitoring
- Smart threshold that detects anomaly from daily operation
- Set warning level based on prediction

Available from check_mk version 1.2.3
Monitor Cronjobs
Before
5 0 * * * root /usr/local/bin/backup >/dev/nullAfter
5 0 * * * root mk-job nightly-backup /usr/local/bin/backup >/dev/nullAvailable from check_mk version 1.2.3
Dive in to the OMD World
I will be sharing how I install OMD, optimized web interface (Multisite), utilized passive checks, implemented 24/7 on call plan, and integrated with automated business processes. I will add link here once they become available.


