You Thought You are Ready
Let’s say your company provide web services or API services that rely on REST. I mean, who doesn’t these days? You’ve got OMD monitoring basic server health and maybe even web server(apache) health. Time to kickback and have a good night sleep right? If there is anything, the monitoring system shall alert us.

Not so fast!! Monitoring server health is the least you have to do to provide 99.999% of service uptime. What if people are able to reach your web server but keep getting 404 Page Not Found or 503 Service Unavailable? Or if there is an DOS attack on web service that happen so fast that brought your server to its knee and you have no idea what hit you?
You Need Metrics that Screams
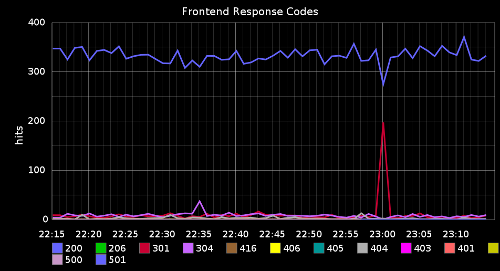
One thing I like about OMD(Check_MK) is that it is able to collect metrics into graphical charts via PNP4Nagios. Having historical graph that keeps track of all the different HTTP response codes will give you the ability to QUICKLY diagnose the root causes of your web server issues. Inspired by the Logstash project, I have wrote a custom script that will generate graphical chart similar to the following:

Not only will OMD collect HTTP response code counts, you can even tweak the custom script I have open sourced on Github to add thresholds to the number of each HTTP response and have the monitoring server send alerts to you.
How to Use the Script
You can find check_http_code_counter script on Github or download it directly from HERE. The script was written in Bash to collect Apache web server HTTP response code from the access log file. Just move the script to /usr/lib/check_mk_agent/local/check_http_code_counter. Make sure to make the script executable.
chmod +x check_http_code_counterWhen the script gets executed, you should get output similar to this:
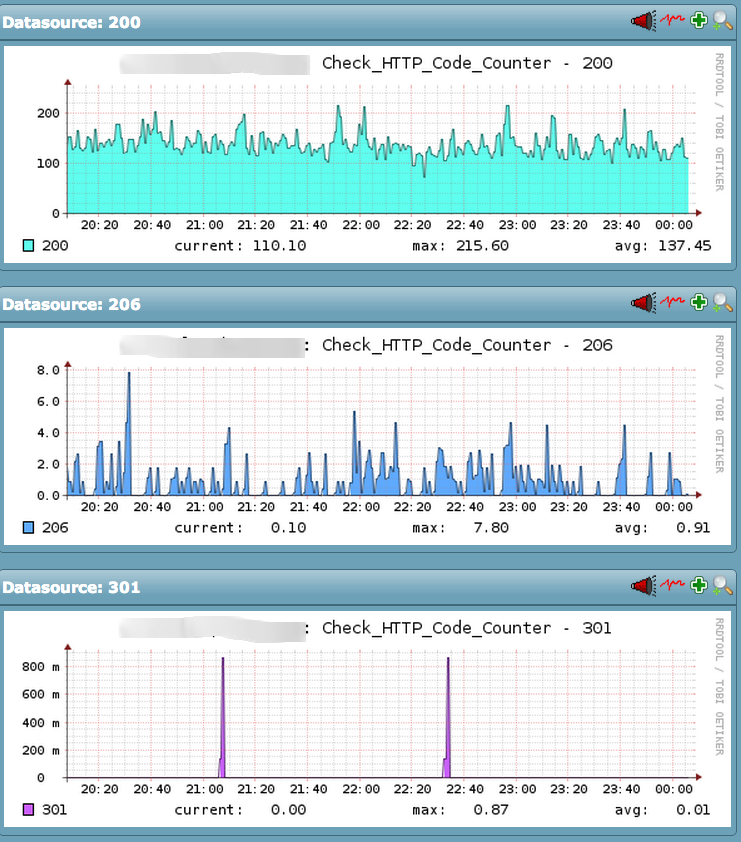
0 Check_HTTP_Code_Counter 200=102|206=3|301=0|304=7|400=0|401=0|403=2|404=0|416=0|500=0|501=0|503=0|504=0 Just collecting status code countsOnce you have the OMD server start collecting data from it, you should have graph that looks like the following over time.

You can modify the beginning of the code for the response codes you would like collect or change the location of your Apache access log. Here is the excerpt of the script:
#!/bin/bash

STATUSCODES="200 206 301 304 400 401 403 404 416 500 501 503 504"
ACCESSLOG="/var/log/apache2/access_log"
Let me know your thoughts and leave comments below.


